Pick a date range
Use the buttons at the top right: 7d, 30d, 90d or 12m. Under the page title you’ll see the dates you’re looking at and the last day the stores have reported (“reported through …”).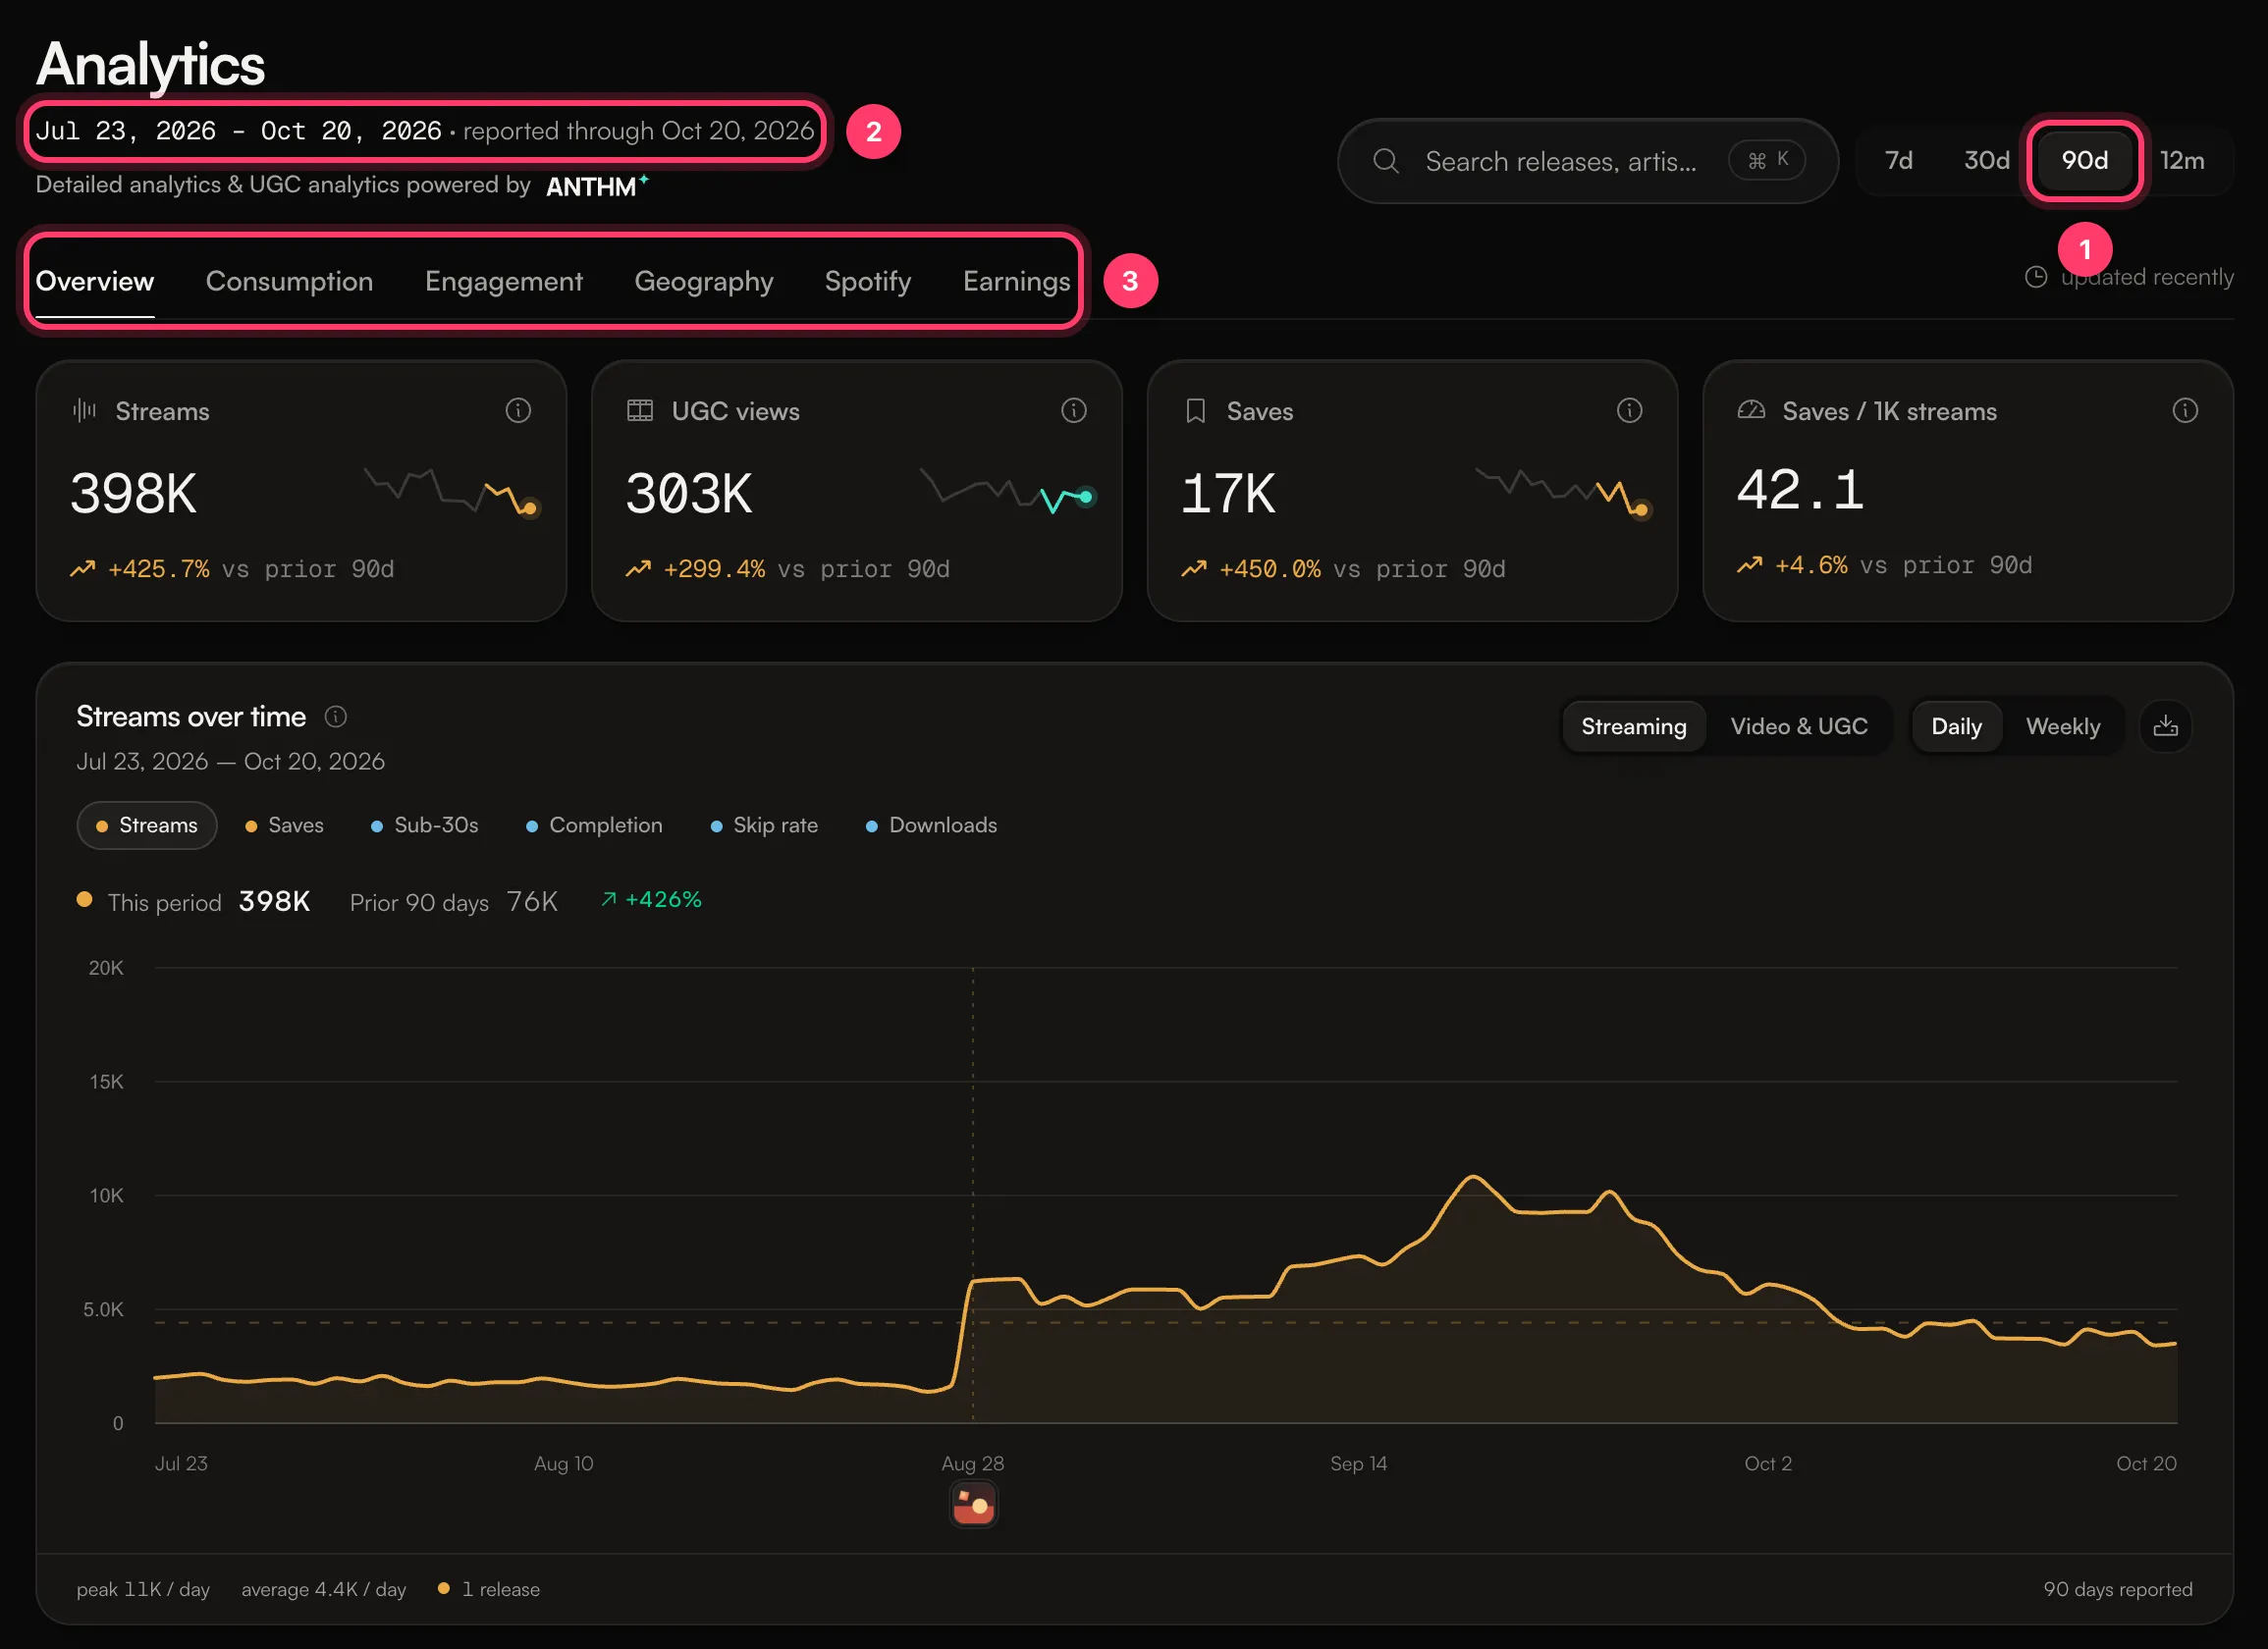
Stores report a few days behind. The newest days in your chart are usually missing or still filling in. A new release takes a week or two to show meaningful numbers.
The tabs
The first four tabs use store reports. Spotify and Earnings have their own dates and are never added to the store numbers.
What the numbers mean
Hover the small i next to a number for its definition. The main ones:- Streams: plays counted by the streaming platforms, after their own fraud filtering.
- UGC views: views of short-form videos that use your music, across TikTok, Reels and Shorts.
- Saves: adds to a listener’s library or playlist.
- Saves / 1K streams: saves per thousand streams, so you can compare tracks of any size.
- Sub-30s: plays that stopped before 30 seconds, so they never became a paid stream.
- Completion and Skip rate: the share of plays that reached the end of the track, and the share a listener skipped out of.
Streams over time
Switch the chart between Streaming and Video & UGC, and between Daily and Weekly. Click the series names (Streams, Saves, Sub-30s and so on) to show or hide them. The download button saves the selected date range as a CSV file.Analytics for one release
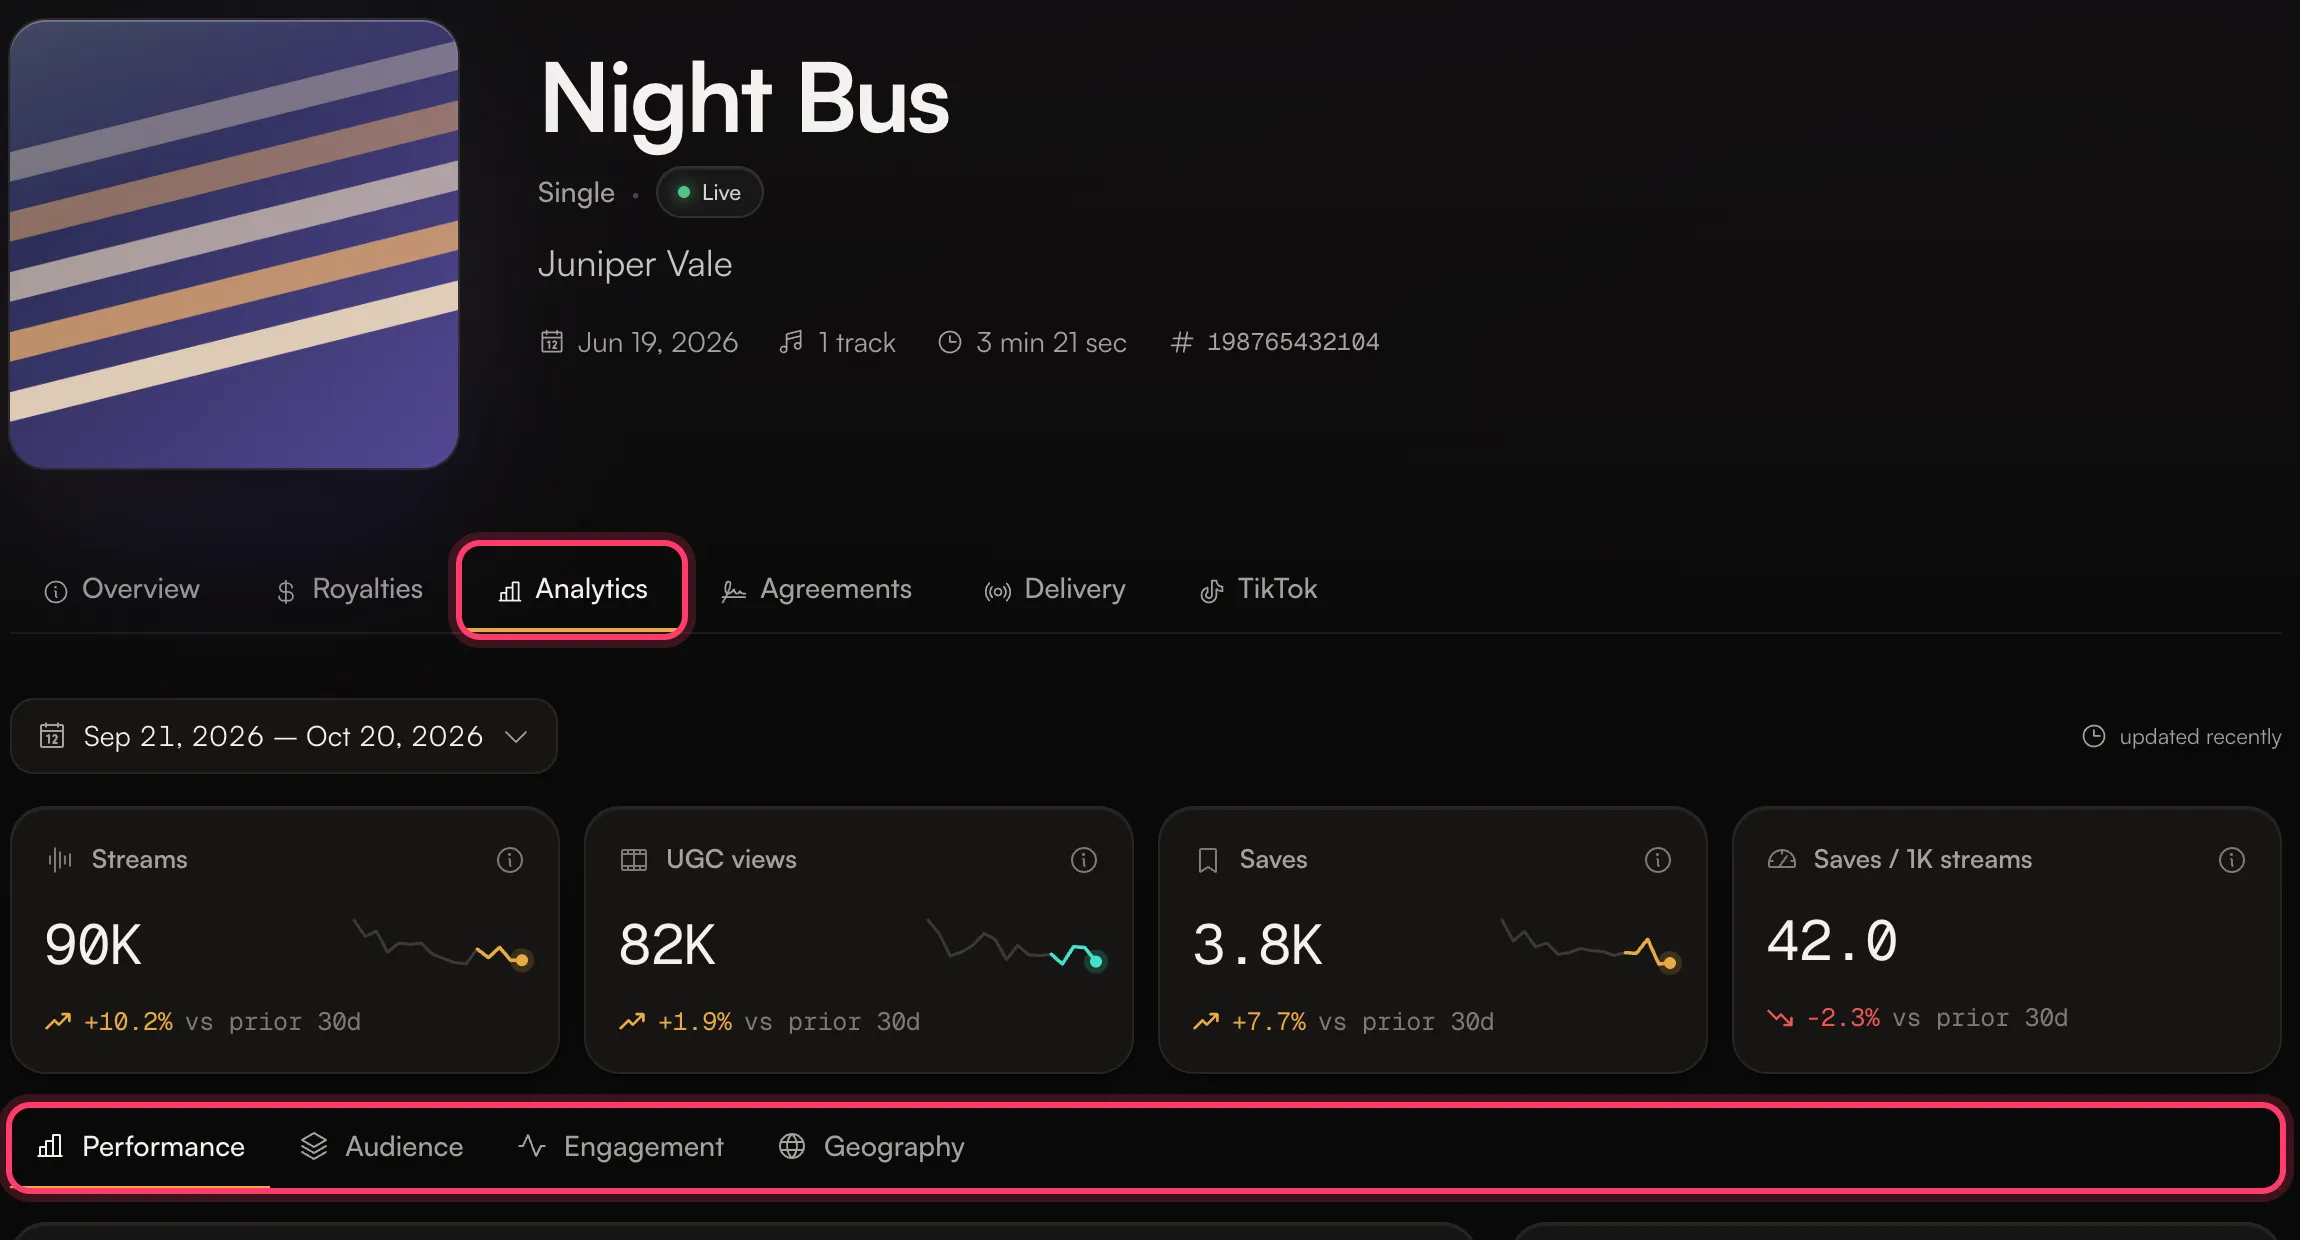
- Open the release from Releases.
- Click the Analytics tab. It appears once the release has been delivered.
- Pick a date range, then use Performance, Audience, Engagement and Geography.